What Is a Double Bottom? A double bottom pattern is a technical analysis charting pattern that describes a change in trend and a momentum reversal
Category: Patterns

What Is an Accumulation Phase? An Accumulation phrase is when the price is bouncing between a range of two numbers for a long period, and

What Is an Ascending Triangle? An ascending triangle is a chart pattern used in technical analysis. It is created by price moves that allow for

What is a Higher Highs (HH) and Higher Lows (HL)? Higher highs and higher lows indicate that an uptrend is occurring with the overall increase

What is Inverse Head And Shoulders? A cup and handle price pattern on a chart is a technical indicator that resembles a cup with a

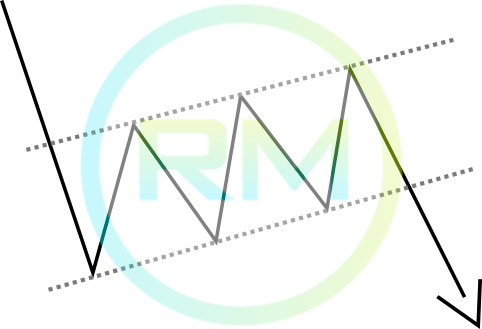
What is a Bullish expanding Triangle? A Bullish expanding Triangle is when the price keeps making HIGHER HIGHS and LOWER LOWS in an uptrend, we

What is Inverse Head And Shoulders? An inverse head and shoulders, also called a “head and shoulders bottom”, is similar to the standard head and

What Is a Bull Pennant? In technical analysis, a bull pennant is a type of continuation pattern formed when there is a large movement in
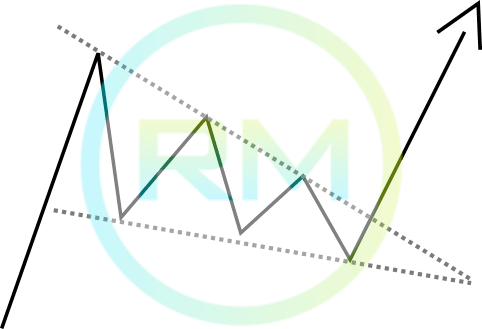
What is a Falling Wedge? When price has been falling over time, a wedge pattern can occur just as the trend makes its final downward